The Home of Global Business Solutions info@ecmgroupza.co.za
Process Improvement & Team Capability

Continuous Improvement

Map processes, investigate delays and rework, and test improvements with your team.

Discuss this service
Service Profile

Make Work Flow Better, With the People Who Do It.

When orders queue up or approvals keep coming back, it helps to look at the whole process. ECM works with your team to map how work moves, investigate delays and rework, and test changes on a manageable scale.

We observe the work, review available data and agree a starting measure before testing a change. Your team helps identify likely causes and assess the results. The methods below give that work a structure suited to the problem.

Improvement Methods and Enablement

  • Process mapping and workflow review, including value-stream mapping to identify delays and waste
  • Structured root-cause analysis using tools such as the 5 Whys and cause-and-effect diagrams
  • Facilitated Kaizen improvement workshops, practical experiments and team coaching
  • Enablement through standard operating procedures, visual management, process owners and performance reviews

The final scope, approach and deliverables are agreed with you before work begins.

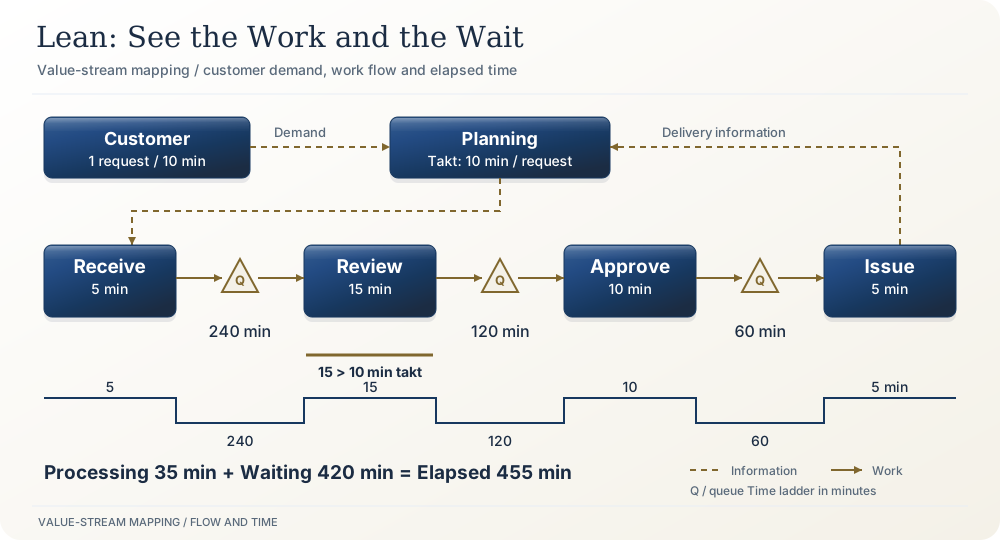
Lean: See the Work and the Wait

On smaller screens, scroll across the diagram to read each step.

A value-stream map separates customer and planning information from the request workflow. Demand is one request every ten minutes. Receive takes five minutes, Review fifteen, Approve ten and Issue five. Queues wait 240, 120 and 60 minutes. A time ladder totals 35 minutes processing and 420 minutes waiting, or 455 minutes elapsed. Review at fifteen minutes exceeds the ten-minute takt. Queue triangles and dashed information links are distinguished from solid work arrows.
A value-stream map separates customer and planning information from the request workflow. Demand is one request every ten minutes. Receive takes five minutes, Review fifteen, Approve ten and Issue five. Queues wait 240, 120 and 60 minutes. A time ladder totals 35 minutes processing and 420 minutes waiting, or 455 minutes elapsed. Review at fifteen minutes exceeds the ten-minute takt. Queue triangles and dashed information links are distinguished from solid work arrows. Worked example with hypothetical timings, not measured client results. Assumes sequential steps for each request, a single reviewer and no overlapping processing for that request. Takt is ten available working minutes per request. Processing time is not automatically value-added time.
What We Do

Understand the Work Before Changing It.

See the Whole Value Stream

Process mapping and workflow review show where work starts, where it waits and how it moves between teams. Value-stream mapping helps expose hand-offs, rework and queues that are easy to miss within one department.

Find the Underlying Cause

Use observations, available data, the 5 Whys and cause-and-effect analysis to investigate a defined problem. Check proposed causes against evidence before committing people and resources to a solution.

Test a Better Way

Facilitated Kaizen sessions turn team experience into practical experiments. Plan, Do, Check, Act (PDCA) suits iterative learning; Define, Measure, Analyse, Improve, Control (DMAIC) can structure a more data-led improvement project.

Build Daily Improvement Habits

Translate an improvement into standard operating procedures, visible measures and regular team reviews. Coaching helps process owners spot drift, respond to exceptions and keep improving after the initial work ends.

The Work Explained

An Improvement Cycle Built Around Real Work

Learn by Doing

  1. Observe

    Map the current process and establish a baseline.

  2. Investigate

    Find where delays or defects arise and test the likely causes.

  3. Experiment

    Try a focused change with the people doing the work.

  4. Standardise

    Keep what works, assign ownership and review the measures.

Repeat the cycle as evidence improves. Targets and measures are agreed for the specific process; savings are not assumed.
Potential Outputs

Process Maps, Experiment Records and Operating Standards.

  • A current-state process map and prioritised improvement opportunities
  • A record of experiments, measures and learning
  • A future-state routine with process owners and review measures

Outputs are selected to suit the engagement and confirmed in the agreed scope.

Your Next Step

Which Process Keeps Getting in the Way?

Describe the delay, rework or recurring problem, and the people affected by it.

Contact ECM Group